Powering Retail Efficiency With New Analytics and Reporting Tools

Retailers deal with shrink in many forms—ranging from the highly visible, like organized retail crime, to the more discreet, such as return fraud. Verkada’s advanced computer vision analytics help retailers combat both, while also gathering operational data that can increase efficiency and improve customer satisfaction.
Today, we’re excited to announce several new video security analytics and reporting features that provide retailers with valuable new insights and make it easier to understand and act on relevant data.
Here's what's new:
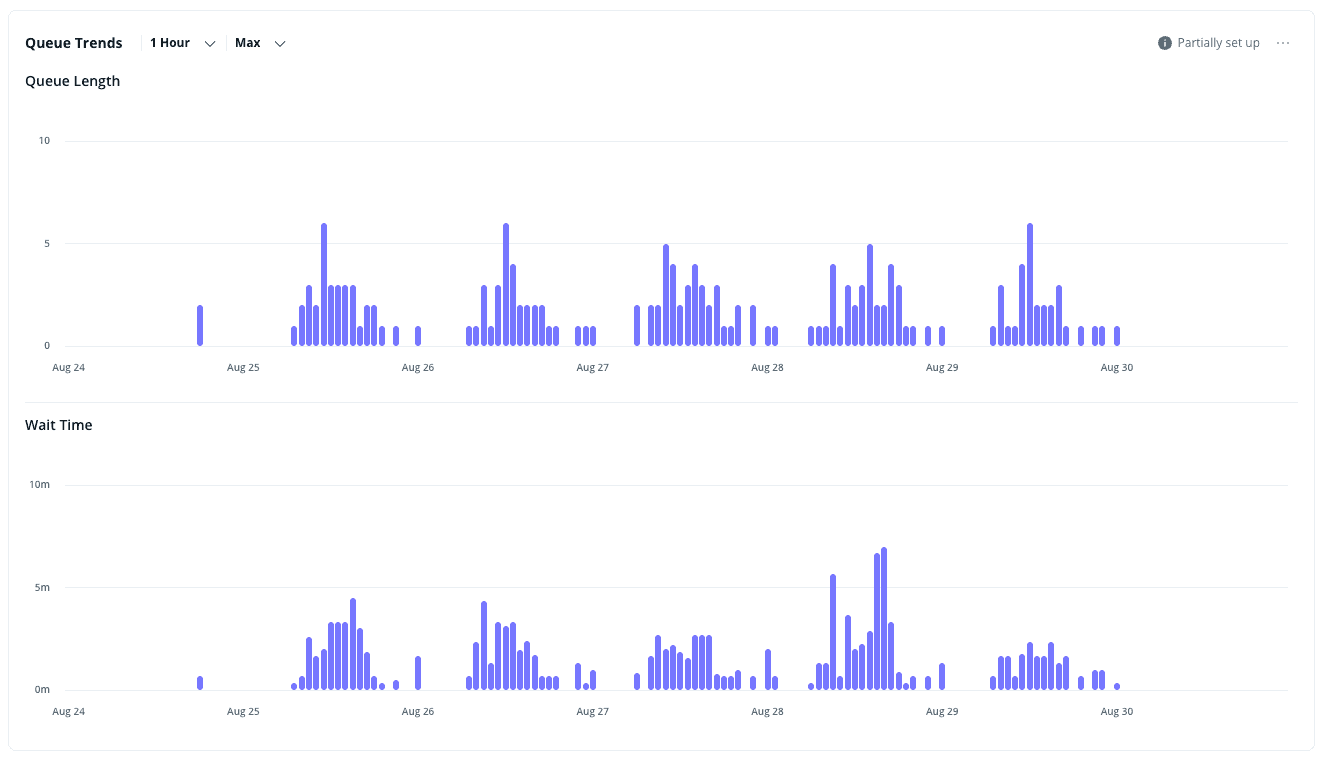
Queue trends: Measure how many people are waiting in line, and for how long.
Conversion trends: Pair occupancy trends with your point-of-sale data to better understand sales conversion rates.
Helix alerts and trends: Set up Helix alerts and create dashboards and reports to visualize sales data and act as a powerful exception-based reporting tool.
Improved dashboard tools: Combine queue, conversion, and sales data into a single view for an enhanced understanding of your store's operations.
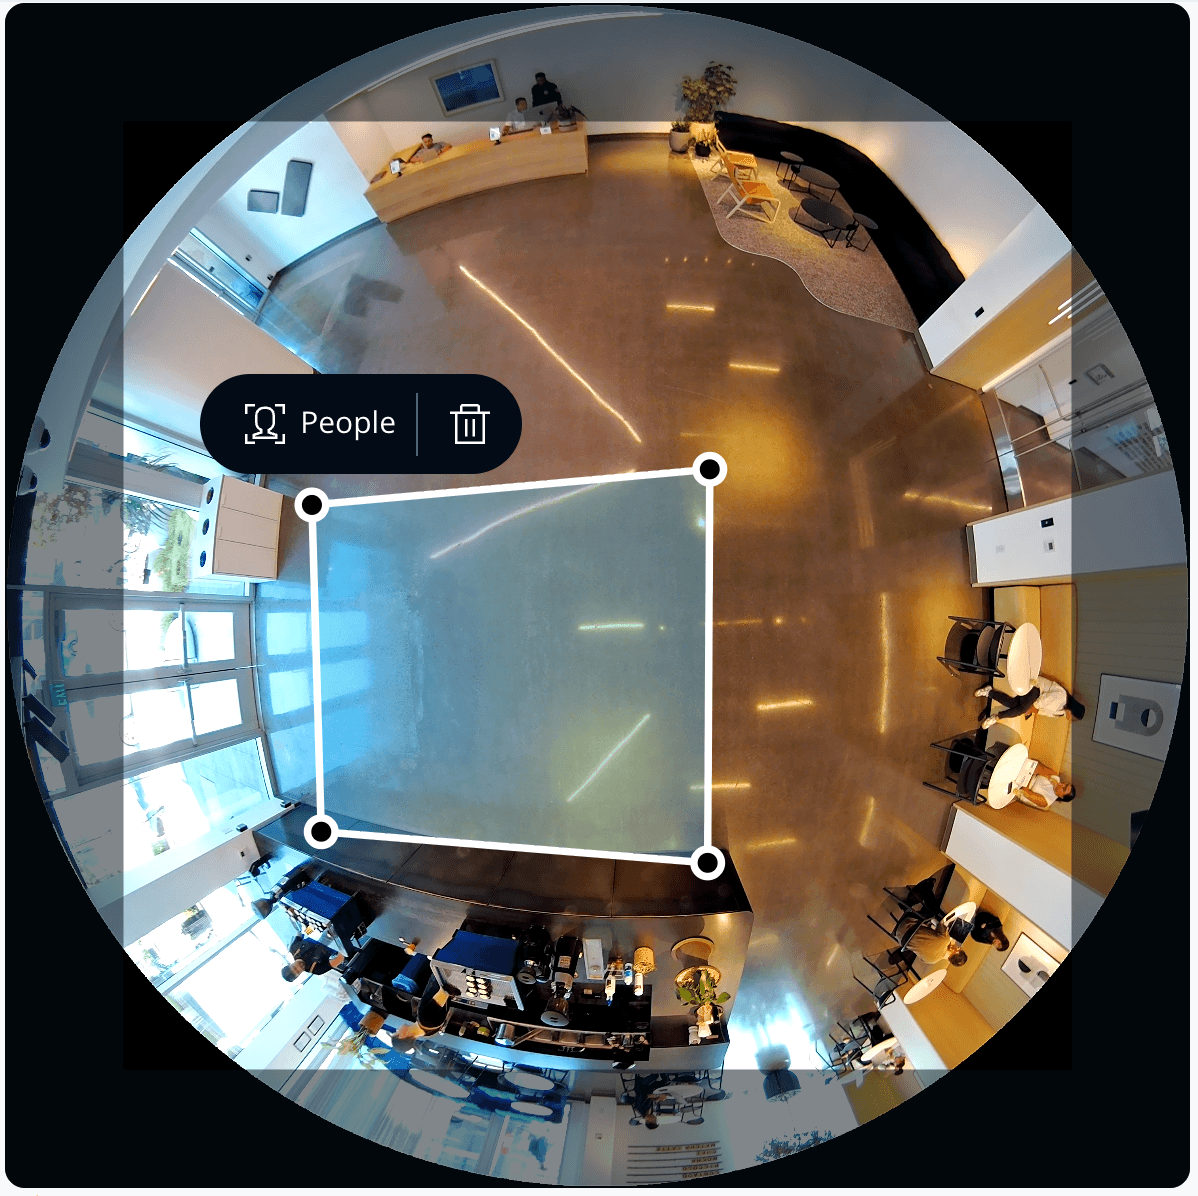
Monitor Queue Lengths and Customer Wait Times
Retailers are always looking for ways to increase customer satisfaction, and spending less time standing in line can make a huge difference for in-store shoppers.
With our new queue trends, you can use cameras to monitor how many people or vehicles are waiting in a line, and for how long. This is useful for checkout lines, dressing room lines, curbside pickup zones, or donation drop-off areas. Store managers can use the resulting data to optimize staffing and identify bottlenecks that could hinder movement through a store or parking lot.
Even outside of retail environments, queue trends can help fast food restaurants streamline drive-thru lines, transportation departments monitor average wait times at bus stops, or K-12 schools track how long parents wait in student pick-up lines.
Pair Occupancy Trends With Point-of-Sale Data to Calculate Sales Conversion Rates
Verkada's occupancy trends feature helps retailers understand foot and vehicle traffic on their cameras over time, so they can better understand how space is being used and more efficiently plan operations.
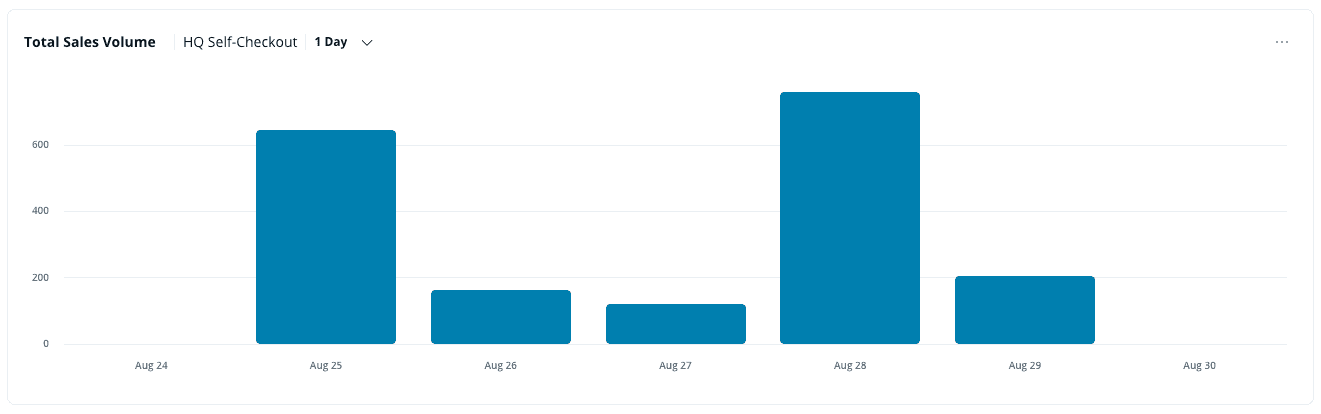
Now, you can take this further with conversion trends. Conversion trends pairs occupancy trend data with point-of-sale data via Helix to calculate the number of people who entered your store that actually ended up making a purchase.
Store managers can view conversion rates at the end of each day, as well as compare week-over-week or month-over-month changes.
Analyze Helix Events With New Alerts and Dashboards
Helix is Verkada’s integration and video search engine, which connects third-party platforms to Verkada Command and surfaces important footage tied to external events. For example, if a retailer’s PoS system flags an unusually high discount, Helix gives managers the ability to quickly review the camera footage of that transaction.
Now, you can create custom, proactive alerts on any third-party data – including exception-based alerts – notifying you the second your business data needs your attention.
And to help you see the bigger picture, we're introducing Helix dashboards, which help you visualize general sales trends across your entire organization and create exception-based reports to surface anomalies.
For example, you could see which employees have initiated the highest number of refunds or transactions with significant discounts over the past month. And while most EBR tools stop at highlighting unusual data, Helix goes further—allowing you to visually verify the activity, such as when a return is processed with only an employee present and no customer in sight.
To monitor sales metrics, you can set up dashboards to visualize transaction volume and revenue over a certain period, such as daily sales totals, peak hours, and most profitable days. You could also compare current sales trends against historical averages.
See All Your Data in One Place on Our Updated Analytics Page
Finally, we have refreshed our Analytics page in Command to make it easier for you to find the data you need in one place. You can easily jump between the Smart Trends page (formerly known as the Camera Analytics page, where occupancy trends dashboards are hosted) and the new Device Stats dashboard.
On the Smart Trends page, you can create widgets for different types of data and place them on one centralized page for easy viewing and comparison. These widgets can include occupancy trends, queue trends, conversion trends, and Helix trends.
Availability
These new features are applicable across many industries, but we are particularly excited to launch them with multi-site retailers in mind. Verkada’s cutting-edge physical security solution not only helps to supercharge loss prevention and protect employees and property, but also provide insights to help customers optimize store performance and improve operations.
These new features are supported on all CXX2 and CXX3 cameras, as well as the CF81, and will be available beginning October 9, 2025.
To get a personalized demo or free trial, contact your Verkada sales representative or email [email protected].